System Monitor II provides you with a desktop display showing an overview of your system, and more.
System Monitor II provides you with a desktop display showing an overview of your system, and more.
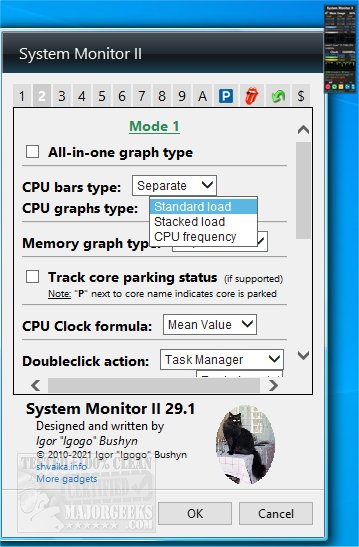
This gadget is a more simple and lightweight version of similar system info apps out there while remaining a powerful option to keep you informed about key points of interest for your system. It displays the amount of memory used. It shows the total, used and free for each of the memory types; RAM, page file, all (RAM + page file). Additionally, System Monitor II displays the processor model and its clock frequency. It loads the processor and each core (or stream) separately, and you can optionally combine them if desired.
System Monitor II is capable of supporting up to 40 cores and multi-CPU systems. It can also show you the temperature for each core and your CPUs' current power consumption, but this will require the installation of Core Temp.
System Monitor also offers the ability to control a few different PC functions like shutdown, stand-by, restart, log off, etc. It also permits you to change your power scheme. The interface is customizable with color, background, graph details, size of the display, and more, making it a well-rounded utility for performing basic PC functions and pulling many important details.
If you are running Windows 8.1 or 10 and are unable to install this app, you may need Desktop Gadgets Revived or similar to utilize it successfully.
System Monitor II Features:
Hover mouse to core's bar to show min and max cores temperature
Hover mouse to any RAM, PageFile, or all elements (except graph) to view maximum appropriate value usage
Click on the CPU vendor icon ( Intel CPU/ AMD CPU/ VIA CPU) or gadget's title to show WEI into flyout; click again - close flyout window.
You can use the mouse wheel (Wheel) for switching between CPUs and different CPU settings in a multi-CPU system. (Don't forget to click on the gadget's body before using the wheel)
Double click on the background to show Task Manager or Resource Monitor
In the flyout window, you can run Performance Information and Tools under Windows Vista, Windows 7, Windows 8.1, and Windows 10 or WinSAT to obtain the Windows Experience Index (WEI) under Windows 8.1 or above. See Get Windows Experience Index (WEI) score in Windows 10/8.1 for detail
Click on the Processor Queue Length string to show details about it
Click on the HT string to show details about it.
Special PC Control panel
Two methods of memory usage percentage styles: overall usage and usage of physical memory
Working with Core Parking from settings
Similar:
Three Ways to Find Out How Many Cores Your CPU has
How to Check Your Memory (RAM) Speed, Available Slots and More
How to Identify the Hardware in Your Computer
How to Find Motherboard Manufacturer, Model, Serial Number, and Version
How to Check What Graphic Card (GPU) Is in Your Computer
Download