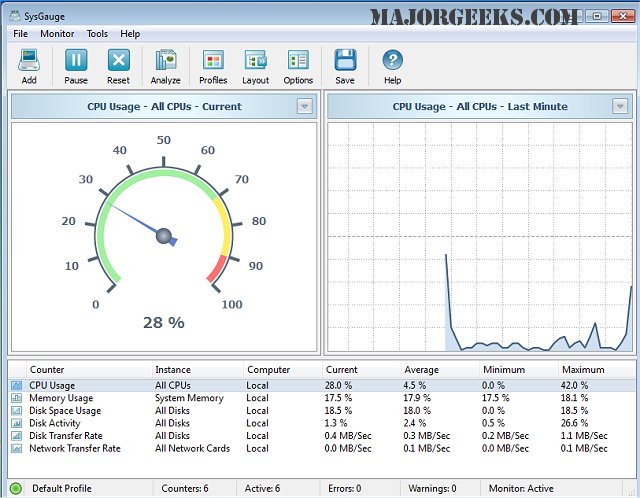
SysGauge version 13.7.14 has been released, enhancing its capabilities to allow users to monitor their machine's performance in real-time across various metrics. The software categorizes performance inquiries into nine distinct areas: All Counters, CPU Usage, Memory Usage, Disk I/O Activity, Network Activity, Operating System, Process Status, File System, and USB Activity. Each category comes with multiple subsets, providing users a comprehensive view of their system's performance through a user-friendly graphical interface.
In addition to real-time monitoring, SysGauge allows users to set custom thresholds for various system monitoring counters. Users can configure the software to display error or warning messages, play notification sounds, and even send email alerts if any monitored parameter exceeds or falls below specified limits. Furthermore, SysGauge can generate periodic status reports, which document up to 24 hours of continuous monitoring history, and these reports can be exported in multiple formats, including HTML, PDF, Excel, Text, CSV, or XML.
This release signifies a step forward in performance monitoring tools, equipping users with the information needed to optimize their system's performance effectively. Enhancements in SysGauge's reporting and notification functionalities make it a valuable tool for users who need to maintain peak system efficiency and quickly respond to any performance issues.
Looking ahead, future updates could focus on integrating AI-driven analytics for predictive monitoring, offering users advanced insights into potential issues before they arise. Additionally, expanding compatibility with various platforms and systems could broaden SysGauge's user base and functionality in diverse computing environments
In addition to real-time monitoring, SysGauge allows users to set custom thresholds for various system monitoring counters. Users can configure the software to display error or warning messages, play notification sounds, and even send email alerts if any monitored parameter exceeds or falls below specified limits. Furthermore, SysGauge can generate periodic status reports, which document up to 24 hours of continuous monitoring history, and these reports can be exported in multiple formats, including HTML, PDF, Excel, Text, CSV, or XML.
This release signifies a step forward in performance monitoring tools, equipping users with the information needed to optimize their system's performance effectively. Enhancements in SysGauge's reporting and notification functionalities make it a valuable tool for users who need to maintain peak system efficiency and quickly respond to any performance issues.
Looking ahead, future updates could focus on integrating AI-driven analytics for predictive monitoring, offering users advanced insights into potential issues before they arise. Additionally, expanding compatibility with various platforms and systems could broaden SysGauge's user base and functionality in diverse computing environments
SysGauge 13.7.14 released
SysGauge enables you to precisely monitor in real-time your machine's performance in numerous areas.