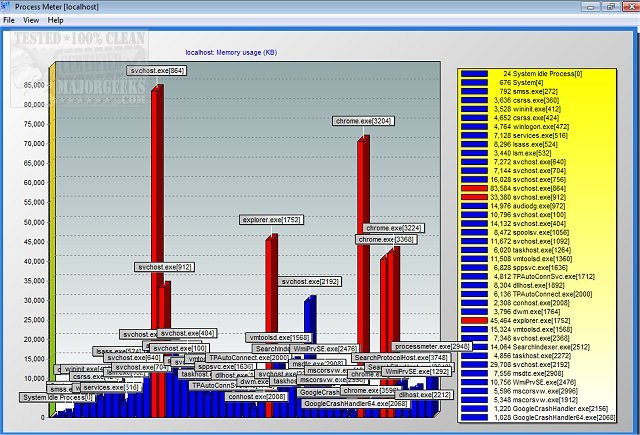
Process Meter version 1.40 has been released, offering enhanced capabilities for monitoring both local and remote system processes. This tool provides comprehensive details regarding various metrics, including address space usage, CPU utilization, handle counts, memory consumption, thread counts, and virtual memory size. Each process is represented visually through color-coded bar graphs, facilitating quick identification of processes that exceed specified limits. Users can customize these limits through the 'Limits' menu, catering to those who prefer visual analysis over traditional data reports.
Additionally, Process Meter enables users to print the charts or save them for record-keeping or future reference. This feature is particularly beneficial for IT professionals and system administrators who need to monitor system performance over time or present data in a more accessible format.
In future developments, it would be advantageous to consider incorporating real-time alerts for when processes exceed set limits, as well as enhancing remote monitoring capabilities to include network latency metrics. Furthermore, adding support for integration with other system management tools could streamline workflows for users managing multiple systems
Additionally, Process Meter enables users to print the charts or save them for record-keeping or future reference. This feature is particularly beneficial for IT professionals and system administrators who need to monitor system performance over time or present data in a more accessible format.
In future developments, it would be advantageous to consider incorporating real-time alerts for when processes exceed set limits, as well as enhancing remote monitoring capabilities to include network latency metrics. Furthermore, adding support for integration with other system management tools could streamline workflows for users managing multiple systems
Process Meter 1.40 released
Process Meter displays details about all local or remote system processes.