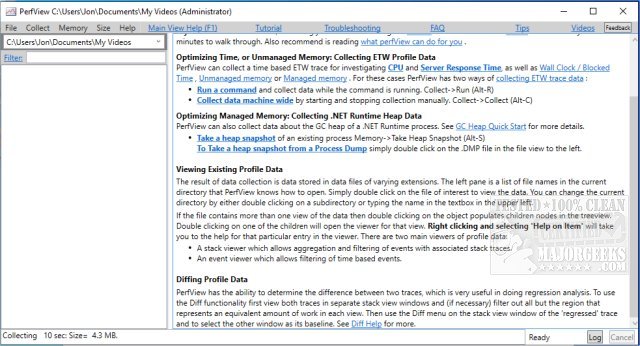
PerfView 4.0.0 has been released, enhancing the capabilities of this portable application that is specifically designed for the collection and analysis of CPU and memory-related performance data. Targeted primarily at application developers, PerfView includes essential tools for analyzing Event Tracing for Windows (ETW) information, such as ETL files, as well as CLR memory data, including heap dumps.
The primary function of PerfView is to aid developers in identifying specific threads or functions that may be causing performance issues in their applications. By analyzing the collected data, users can pinpoint the source of the problem and make necessary bug fixes or optimizations. PerfView accomplishes this by capturing a snapshot of the CPU stacks and can target all processes or a specific executable for detailed troubleshooting. The application provides an overview of the stack collection, including the total CPU cost associated with various operations.
For users new to PerfView, it is highly recommended to review the available guides before diving into the analysis process. These resources can help users maximize the benefits of the tool and ensure an efficient troubleshooting experience.
In addition to its core functionalities, PerfView can support the optimization process through integration with other diagnostic tools, offering a comprehensive suite for developers aiming to enhance application performance. By continually improving and updating its features, PerfView remains a crucial asset for developers looking to maintain optimal application performance
The primary function of PerfView is to aid developers in identifying specific threads or functions that may be causing performance issues in their applications. By analyzing the collected data, users can pinpoint the source of the problem and make necessary bug fixes or optimizations. PerfView accomplishes this by capturing a snapshot of the CPU stacks and can target all processes or a specific executable for detailed troubleshooting. The application provides an overview of the stack collection, including the total CPU cost associated with various operations.
For users new to PerfView, it is highly recommended to review the available guides before diving into the analysis process. These resources can help users maximize the benefits of the tool and ensure an efficient troubleshooting experience.
In addition to its core functionalities, PerfView can support the optimization process through integration with other diagnostic tools, offering a comprehensive suite for developers aiming to enhance application performance. By continually improving and updating its features, PerfView remains a crucial asset for developers looking to maintain optimal application performance
PerfView 4.0.0 released
PerfView is a portable application designed to simplify the collection/analysis of CPU and memory-related performance data.