PerfView is a portable application designed to simplify the collection/analysis of CPU and memory-related performance data.
PerfView is a portable application designed to simplify the collection/analysis of CPU and memory-related performance data.
PerfView is geared towards app developers and contains all the essential tools required for ETW information (ETL files) and CLR memory data (heap dumps) analysis. It is crafted to help narrow down a specific thread or function that causes performance issues and directs you to the source code, allowing you to perform a bug fix or optimization.
PerfView works by taking a snapshot of the stacks, interrupting your CPU. PerfView takes the stack of all the processes (you also can select a specific EXE for troubleshooting). PerfView can then display the stack collection name frame, including the CPU's total cost and the total amount of the cost.
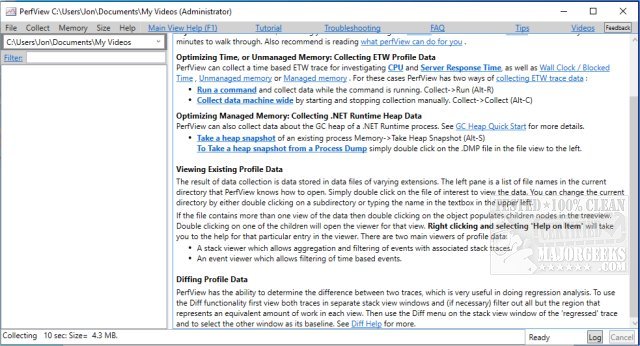
There are guides available, and they are highly recommended reading before you jump in.
Similar:
How to Use the Windows Memory Diagnostic Tool in Windows
How to Check Your Memory (RAM) Speed, Available Slots and More
How to Change Windows Defender Max CPU Usage
How to Manage Virtual Memory (Pagefile) in Windows 10 & 11
Download