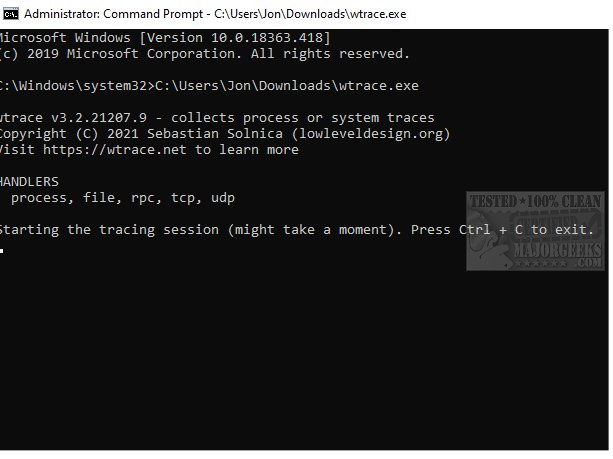
The latest version of wtrace, a portable command-line tool designed for live recording of trace events, has been released. Wtrace is capable of capturing a variety of system activities, including File I/O operations, Registry modifications, TCP/IP connections, and RPC calls. This tool is particularly useful for users looking to gain insights into system behavior and occurrences.
Key Features:
- Live Recording: Wtrace allows for real-time monitoring and recording of various trace events.
- Diverse Event Tracking: The tool can track multiple activities including file operations, registry changes, network connections, and remote procedure calls.
- Filtering Capabilities: Users can apply filters to focus on specific events of interest, enhancing the utility of the data collected.
- Data Statistics: At the conclusion of a tracing session, wtrace can generate and display statistics summarizing the recorded events.
- Integration with Other Tools: As a standard command-line utility, its output can be piped into other tools for further analysis or processing.
For detailed documentation and usage parameters, users can refer to the official resources available online.
Related Topics:
- Command Prompt Access in Windows 11: Explore various methods to open the Command Prompt.
- Running Windows Terminal, PowerShell, or Command Prompt as Administrator: Learn how to execute these tools with elevated permissions.
- Resetting TCP/IP or Internet Protocol: Step-by-step guidance on resetting TCP/IP settings for troubleshooting network issues.
In conclusion, wtrace 3.5 is an essential tool for developers and IT professionals who require a robust method for monitoring system activities, providing both flexibility and comprehensive trace data for analysis
wtrace 3.5 released
wtrace is a portable command-line tool for live recording of trace events.