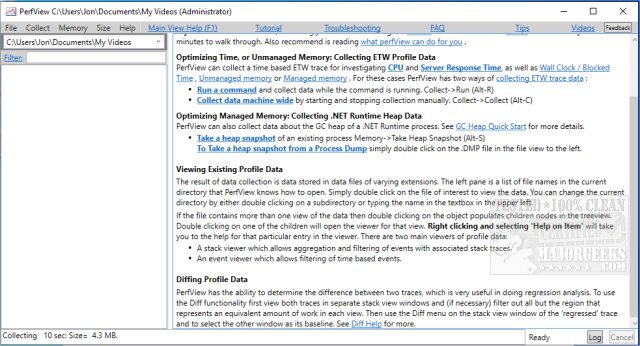
PerfView 3.2.6 has been released, enhancing its functionality as a portable application designed to streamline the collection and analysis of CPU and memory performance data. This tool is particularly beneficial for app developers, as it provides essential capabilities for analyzing Event Tracing for Windows (ETW) information from ETL files and CLR memory data from heap dumps.
PerfView aims to assist developers in pinpointing specific threads or functions that may lead to performance bottlenecks, facilitating direct access to the relevant source code for bug fixing or optimization. The application operates by capturing snapshots of the CPU stacks, which can be paused to analyze the performance of all running processes or a specific executable file. It also presents a detailed view of stack costs, allowing developers to assess the total CPU usage and performance impact of each function or thread.
For users new to PerfView, it is highly recommended to consult the available guides before diving into the tool's functionalities, ensuring a more effective and informed usage experience.
In addition to PerfView, users may find the following related resources helpful:
- A guide on using the Windows Memory Diagnostic Tool.
- Instructions for checking RAM speed and available slots.
- Tips on managing Windows Defender's CPU usage.
- Information on managing virtual memory, including pagefile settings in Windows 10 and 11.
Overall, PerfView 3.2.6 offers a robust solution for performance analysis, enabling developers to optimize their applications effectively
PerfView aims to assist developers in pinpointing specific threads or functions that may lead to performance bottlenecks, facilitating direct access to the relevant source code for bug fixing or optimization. The application operates by capturing snapshots of the CPU stacks, which can be paused to analyze the performance of all running processes or a specific executable file. It also presents a detailed view of stack costs, allowing developers to assess the total CPU usage and performance impact of each function or thread.
For users new to PerfView, it is highly recommended to consult the available guides before diving into the tool's functionalities, ensuring a more effective and informed usage experience.
In addition to PerfView, users may find the following related resources helpful:
- A guide on using the Windows Memory Diagnostic Tool.
- Instructions for checking RAM speed and available slots.
- Tips on managing Windows Defender's CPU usage.
- Information on managing virtual memory, including pagefile settings in Windows 10 and 11.
Overall, PerfView 3.2.6 offers a robust solution for performance analysis, enabling developers to optimize their applications effectively
PerfView 3.2.6 released
PerfView is a portable application designed to simplify the collection/analysis of CPU and memory-related performance data.