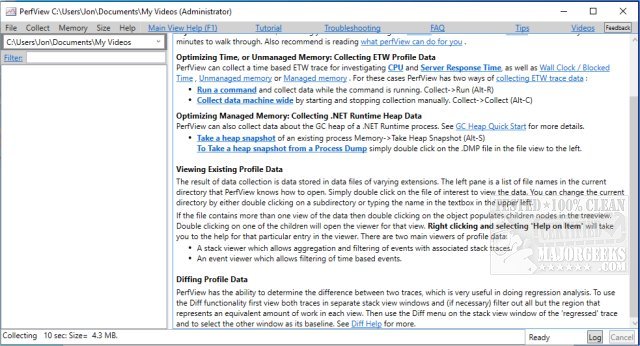
PerfView 3.2.5 has been released, enhancing its capabilities as a portable application designed for developers to efficiently collect and analyze CPU and memory-related performance data. This version is particularly useful for application developers as it includes vital tools for analyzing Event Tracing for Windows (ETW) information from ETL files and CLR memory data through heap dumps.
PerfView assists users in identifying specific threads or functions that may be contributing to performance issues, providing a direct pathway to the source code for subsequent bug fixes or optimizations. The application operates by capturing a snapshot of the CPU stacks, allowing users to analyze the performance of all processes or focus on a specific executable for detailed troubleshooting. It presents the stack collection name frame, which includes metrics such as the total CPU cost and the overall performance cost, enabling developers to pinpoint inefficiencies.
The release encourages users to consult the available guides before diving into the analysis, as these resources can significantly enhance the user experience and effectiveness in utilizing the application.
In addition to its core functionalities, PerfView also opens the door for further exploration of performance optimization tools. Developers might consider integrating PerfView with other performance monitoring solutions or expanding their knowledge on related topics, such as optimizing memory usage, understanding CPU allocation, and managing system resources efficiently. By leveraging this tool alongside best practices in performance tuning, developers can achieve a more streamlined and effective application development process
PerfView assists users in identifying specific threads or functions that may be contributing to performance issues, providing a direct pathway to the source code for subsequent bug fixes or optimizations. The application operates by capturing a snapshot of the CPU stacks, allowing users to analyze the performance of all processes or focus on a specific executable for detailed troubleshooting. It presents the stack collection name frame, which includes metrics such as the total CPU cost and the overall performance cost, enabling developers to pinpoint inefficiencies.
The release encourages users to consult the available guides before diving into the analysis, as these resources can significantly enhance the user experience and effectiveness in utilizing the application.
In addition to its core functionalities, PerfView also opens the door for further exploration of performance optimization tools. Developers might consider integrating PerfView with other performance monitoring solutions or expanding their knowledge on related topics, such as optimizing memory usage, understanding CPU allocation, and managing system resources efficiently. By leveraging this tool alongside best practices in performance tuning, developers can achieve a more streamlined and effective application development process
PerfView 3.2.5 released
PerfView is a portable application designed to simplify the collection/analysis of CPU and memory-related performance data.