PerfView version 3.2.4 has been released, enhancing its capabilities as a portable application focused on the collection and analysis of CPU and memory performance data. Aimed primarily at application developers, PerfView provides essential tools for analyzing Event Tracing for Windows (ETW) information, specifically ETL files, and CLR memory data through heap dumps. This tool is particularly useful for identifying performance bottlenecks by pinpointing specific threads or functions that may be causing issues, thus guiding developers directly to the relevant source code for bug fixing or optimization.
The application operates by taking snapshots of stack traces, which involves briefly interrupting the CPU to gather data. Users can analyze the performance of all running processes and even focus on a specific executable file for troubleshooting purposes. Once the data is collected, PerfView presents a detailed view of the stack collection, including metrics on CPU usage and the associated costs.
For those looking to maximize their use of PerfView, it is recommended to consult the available guides prior to getting started, as these resources provide valuable insights and instructions. Additionally, users may find it beneficial to explore related tools and features, such as the Windows Memory Diagnostic Tool, methods to check RAM speed, and techniques for managing virtual memory settings in Windows 10 and 11.
As the software landscape continues to evolve, PerfView remains an important tool for developers aiming to enhance application performance, and ongoing updates will likely introduce new features and improvements to further streamline performance analysis
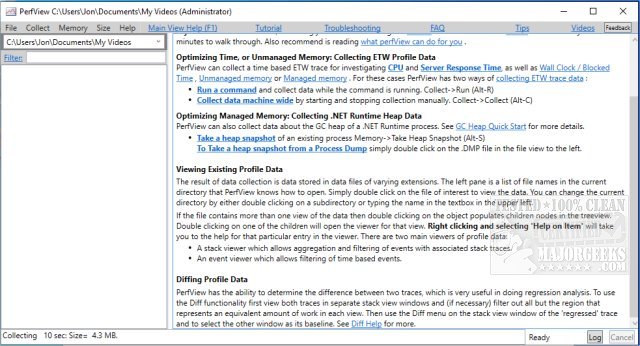
PerfView 3.2.4 released
PerfView is a portable application designed to simplify the collection/analysis of CPU and memory-related performance data.