PerfView 3.2.3 has been released as a powerful, portable application aimed at facilitating the collection and analysis of CPU and memory performance data. It is particularly beneficial for application developers, as it provides essential tools for analyzing Event Tracing for Windows (ETW) information and Common Language Runtime (CLR) memory data, including heap dumps. PerfView helps users identify specific threads or functions that may be causing performance issues, and it directs them to the relevant source code for potential bug fixes or optimizations.
The application operates by capturing snapshots of the CPU stacks, temporarily interrupting processes to collect data. Users can analyze all running processes or focus on a particular executable to troubleshoot performance problems. PerfView presents the collected stack data, including the total CPU cost associated with each stack frame, making it easier for developers to pinpoint the source of inefficiencies.
For those new to PerfView, it is highly recommended to consult the available guides to maximize the application's utility. Additionally, users may find similar resources helpful, such as guides on using the Windows Memory Diagnostic Tool, checking RAM specifications, adjusting Windows Defender CPU usage, and managing virtual memory settings in Windows 10 and 11.
In summary, PerfView 3.2.3 is a comprehensive tool for developers seeking to enhance application performance through in-depth analysis of CPU and memory usage. With its user-friendly interface and rich feature set, it stands as a vital resource for optimizing software efficiency. As development continues, future updates may introduce enhanced functionalities, making it even more indispensable for performance tuning
PerfView 3.2.3 released
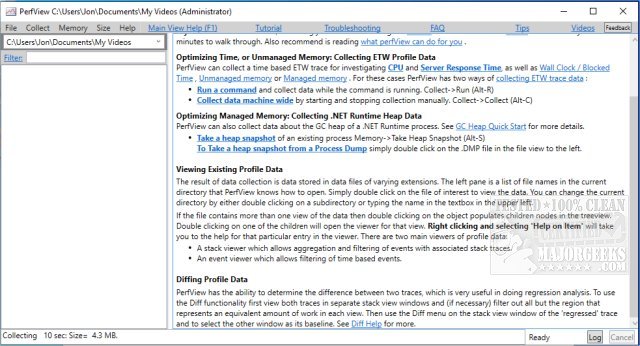
PerfView is a portable application designed to simplify the collection/analysis of CPU and memory-related performance data.