PerfView 3.1.26 has been released, enhancing its capabilities as a portable application designed for the efficient collection and analysis of CPU and memory performance data. Targeted primarily at application developers, PerfView equips users with all the necessary tools to analyze Event Tracing for Windows (ETW) information, such as ETL files, as well as Common Language Runtime (CLR) memory data, including heap dumps.
The application aims to assist developers in identifying specific threads or functions that may be causing performance issues, ultimately guiding them to the relevant source code for bug fixes or optimizations. PerfView operates by capturing snapshots of the CPU stacks, allowing it to interrupt the CPU to collect stack information from all running processes, or to focus on a specific executable for more targeted troubleshooting. The tool can present a detailed view of stack collection names, including the total CPU cost and the overall resource utilization.
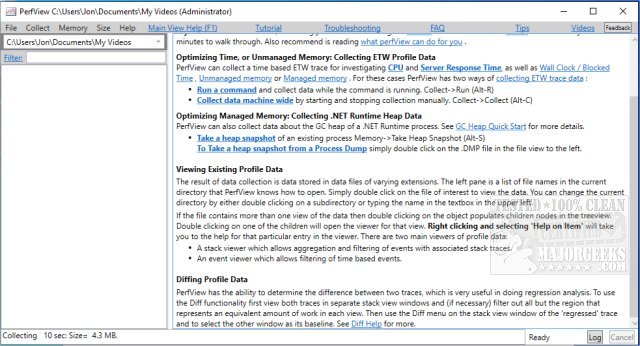
To maximize the effectiveness of PerfView, users are encouraged to consult the available guides, which provide essential insights for navigating the application and understanding its features.
In addition to its core functionalities, PerfView can be a valuable tool in the broader context of performance monitoring and optimization, complementing practices such as using the Windows Memory Diagnostic Tool, checking RAM specifications, managing CPU usage for antivirus software, and handling virtual memory settings in Windows 10 and 11. As performance optimization continues to be crucial in software development, tools like PerfView play an integral role in enhancing application efficiency and reliability
The application aims to assist developers in identifying specific threads or functions that may be causing performance issues, ultimately guiding them to the relevant source code for bug fixes or optimizations. PerfView operates by capturing snapshots of the CPU stacks, allowing it to interrupt the CPU to collect stack information from all running processes, or to focus on a specific executable for more targeted troubleshooting. The tool can present a detailed view of stack collection names, including the total CPU cost and the overall resource utilization.
To maximize the effectiveness of PerfView, users are encouraged to consult the available guides, which provide essential insights for navigating the application and understanding its features.
In addition to its core functionalities, PerfView can be a valuable tool in the broader context of performance monitoring and optimization, complementing practices such as using the Windows Memory Diagnostic Tool, checking RAM specifications, managing CPU usage for antivirus software, and handling virtual memory settings in Windows 10 and 11. As performance optimization continues to be crucial in software development, tools like PerfView play an integral role in enhancing application efficiency and reliability
PerfView 3.1.26 released
PerfView is a portable application designed to simplify the collection/analysis of CPU and memory-related performance data.