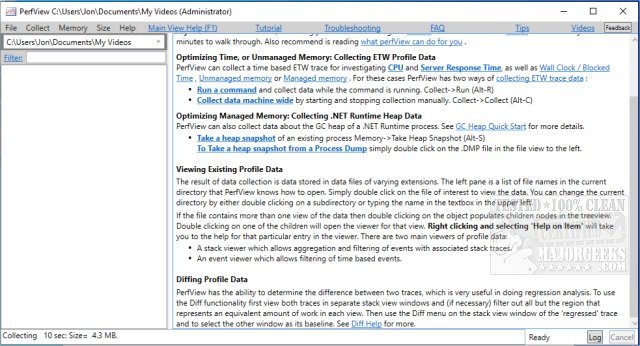
PerfView 3.2.8 has been released, enhancing its capabilities as a portable application aimed at streamlining the collection and analysis of CPU and memory performance data. Targeted towards application developers, PerfView includes essential tools for analyzing Event Tracing for Windows (ETW) information through ETL files and CLR memory data via heap dumps.
The application is designed to facilitate the identification of specific threads or functions that may be responsible for performance problems, directly linking users to the relevant source code for bug fixing or optimization. PerfView operates by capturing stack traces while temporarily interrupting CPU activity, allowing users to analyze the performance impact of all processes or a particular executable file. The collected data includes detailed information about the stack collection name frame, CPU cost, and total performance impact.
For optimal usage, users are encouraged to consult the available guides that provide essential insights into the software's functionality before diving into performance analysis.
Additionally, the release of PerfView 3.2.8 signifies ongoing improvements in performance monitoring tools, which are crucial in a landscape where application efficiency is paramount. As software development continues to evolve, tools like PerfView will play an increasingly vital role in ensuring applications run smoothly and efficiently, minimizing resource consumption and enhancing user experience. Developers can also look forward to potential future updates and features that may further improve the performance diagnostics process, enabling them to tackle performance issues more effectively
The application is designed to facilitate the identification of specific threads or functions that may be responsible for performance problems, directly linking users to the relevant source code for bug fixing or optimization. PerfView operates by capturing stack traces while temporarily interrupting CPU activity, allowing users to analyze the performance impact of all processes or a particular executable file. The collected data includes detailed information about the stack collection name frame, CPU cost, and total performance impact.
For optimal usage, users are encouraged to consult the available guides that provide essential insights into the software's functionality before diving into performance analysis.
Additionally, the release of PerfView 3.2.8 signifies ongoing improvements in performance monitoring tools, which are crucial in a landscape where application efficiency is paramount. As software development continues to evolve, tools like PerfView will play an increasingly vital role in ensuring applications run smoothly and efficiently, minimizing resource consumption and enhancing user experience. Developers can also look forward to potential future updates and features that may further improve the performance diagnostics process, enabling them to tackle performance issues more effectively
PerfView 3.2.8 released
PerfView is a portable application designed to simplify the collection/analysis of CPU and memory-related performance data.