PerfView 3.1.28 has been released as a portable application designed to facilitate the collection and analysis of CPU and memory performance data. Targeted primarily at application developers, PerfView offers essential tools for analyzing Event Tracing for Windows (ETW) information through ETL files, as well as Common Language Runtime (CLR) memory data via heap dumps. This application is instrumental in identifying specific threads or functions that may be causing performance issues, guiding developers directly to the relevant source code for potential bug fixes or optimizations.
The functionality of PerfView includes taking snapshots of the CPU stacks by temporarily interrupting the CPU. It can capture stack data from all running processes, or users can select a specific executable for focused troubleshooting. The application is capable of displaying detailed stack collection names, along with the total CPU cost associated with each frame, providing insights into performance bottlenecks.
For optimal use, it is recommended that users familiarize themselves with the provided guides before diving into the application, as they offer valuable insights on effectively utilizing PerfView’s capabilities.
In addition to PerfView, there are also similar tools and resources available for managing system performance, such as guides on using the Windows Memory Diagnostic Tool, checking RAM speed and availability, adjusting Windows Defender's CPU usage, and managing virtual memory in Windows 10 and 11. Extending the capabilities of PerfView and these resources can significantly enhance a developer's ability to optimize application performance and ensure a smoother user experience
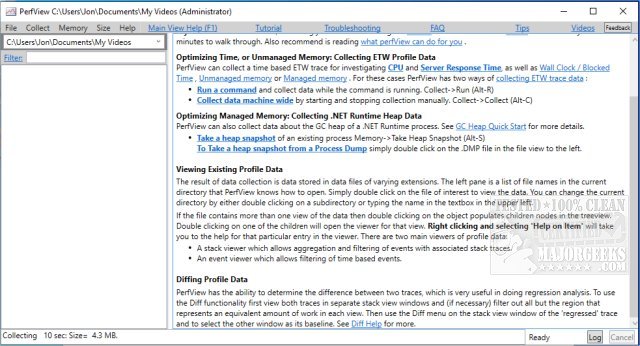
PerfView 3.1.28 released
PerfView is a portable application designed to simplify the collection/analysis of CPU and memory-related performance data.