PerfView 3.1.24 has been released, continuing its mission as a lightweight and portable application focused on simplifying the collection and analysis of CPU and memory performance data. Targeted primarily at application developers, PerfView offers a comprehensive suite of tools that enable users to analyze ETW (Event Tracing for Windows) data from ETL files and CLR (Common Language Runtime) memory data through heap dumps.
The application is particularly effective in identifying specific threads or functions that may be causing performance bottlenecks. By providing insights that direct developers to the corresponding source code, PerfView facilitates efficient bug fixing and optimization processes.
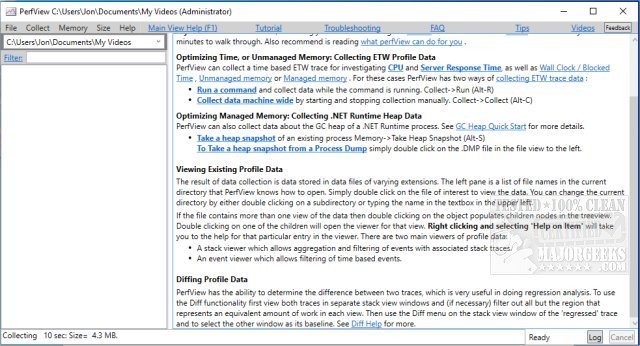
The functionality of PerfView revolves around taking snapshots of the CPU stacks, allowing users to interrupt the CPU process and capture the stack traces of all running processes. Additionally, users can select a specific executable (EXE) for targeted troubleshooting. The application presents a detailed view of the stack collection, showcasing the total CPU cost alongside the accumulated resource usage.
To maximize the benefits of PerfView, it is advisable for users to consult the available guides before diving into the analysis process. These resources can enhance understanding and ensure effective utilization of the tool's capabilities.
In summary, PerfView 3.1.24 is a powerful tool for developers aiming to optimize application performance by providing detailed insights into CPU and memory usage. Its user-friendly interface and robust analytical features make it an essential part of the performance optimization toolkit. Users are encouraged to explore its functionalities and leverage the provided documentation for the best results.
Moreover, as technology continues to evolve, PerfView may integrate additional features in future releases, such as enhanced visualizations, support for more programming languages, or improved collaboration tools for teams. This would further solidify its position as a leading performance analysis tool, catering to the increasingly complex demands of modern software development
The application is particularly effective in identifying specific threads or functions that may be causing performance bottlenecks. By providing insights that direct developers to the corresponding source code, PerfView facilitates efficient bug fixing and optimization processes.
The functionality of PerfView revolves around taking snapshots of the CPU stacks, allowing users to interrupt the CPU process and capture the stack traces of all running processes. Additionally, users can select a specific executable (EXE) for targeted troubleshooting. The application presents a detailed view of the stack collection, showcasing the total CPU cost alongside the accumulated resource usage.
To maximize the benefits of PerfView, it is advisable for users to consult the available guides before diving into the analysis process. These resources can enhance understanding and ensure effective utilization of the tool's capabilities.
In summary, PerfView 3.1.24 is a powerful tool for developers aiming to optimize application performance by providing detailed insights into CPU and memory usage. Its user-friendly interface and robust analytical features make it an essential part of the performance optimization toolkit. Users are encouraged to explore its functionalities and leverage the provided documentation for the best results.
Moreover, as technology continues to evolve, PerfView may integrate additional features in future releases, such as enhanced visualizations, support for more programming languages, or improved collaboration tools for teams. This would further solidify its position as a leading performance analysis tool, catering to the increasingly complex demands of modern software development
PerfView 3.1.24 released
PerfView is a portable application designed to simplify the collection/analysis of CPU and memory-related performance data.