PerfView 3.1.21 has been released, enhancing its functionality as a portable application designed for developers seeking to analyze CPU and memory-related performance data effectively. This tool is particularly valuable for application developers, providing essential utilities for analyzing Event Tracing for Windows (ETW) information, such as ETL files, and Common Language Runtime (CLR) memory data, like heap dumps.
PerfView's functionality allows developers to pinpoint specific threads or functions that may be responsible for performance issues, guiding them directly to the relevant source code for bug fixes or optimizations. The application captures snapshots of process stacks while temporarily interrupting CPU activity, enabling users to visualize the stack collection, including the CPU's total cost associated with each process.
For users new to PerfView, comprehensive guides are available and are highly recommended to maximize the effectiveness of the application. These resources can help users understand how to utilize PerfView properly, as well as provide valuable insights into related topics such as managing memory diagnostics and CPU usage in Windows environments.
In extending the capabilities of PerfView, future updates could incorporate more intuitive user interfaces, automated troubleshooting suggestions based on common performance issues, and enhanced visualization tools to better represent the data collected. Moreover, supporting additional platforms and integrating with cloud-based analytics could broaden its usability for a wider range of developers and system administrators
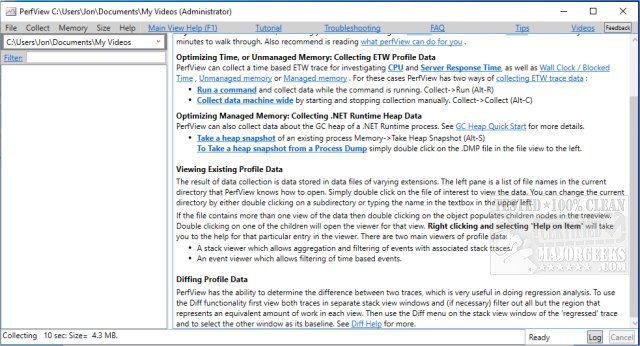
PerfView 3.1.21 released
PerfView is a portable application designed to simplify the collection/analysis of CPU and memory-related performance data.