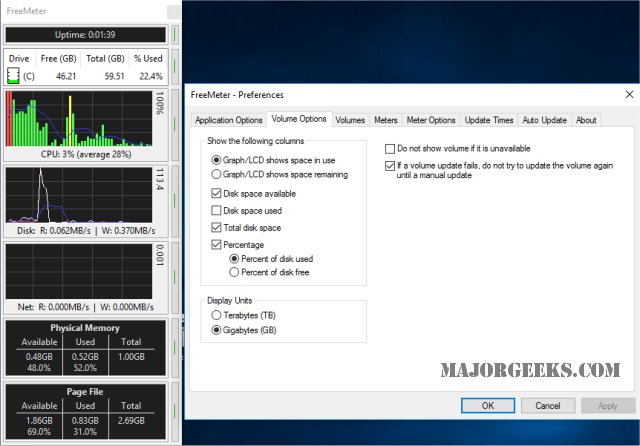
FreeMeter 2.39.0 has been released, offering an efficient tool for monitoring system performance while minimizing resource usage. The application utilizes a bar graph format where red bars signal 98% or higher utilization, yellow indicates 90% or more, and green represents less than 90% utilization. Additionally, a blue horizontal line may appear on each graph to denote the 30-second average for the respective meter. For users of FreeMeter Professional, there is the option to customize percentage thresholds and the corresponding colors.
A convenient feature of FreeMeter is its ability to quickly hide the window with a double-click on the title bar; it can be restored by double-clicking the system tray icon, all while the application continues to collect data in the background.
In future updates, it would be beneficial for FreeMeter to introduce more customizable features such as user-defined alerts for specific performance metrics, integration with other monitoring tools, or even enhanced visualizations for better user experience. Additionally, adding compatibility with various operating systems could broaden its user base
FreeMeter 2.39.0 released
FreeMeter is designed to monitor your system performance without using too many resources.