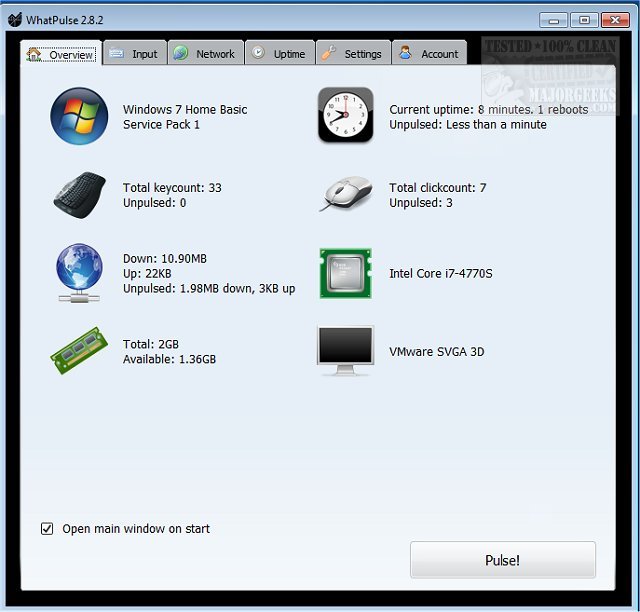
WhatPulse has released version 6.1, a tool tailored for users interested in quantifying their computer activity. It meticulously tracks keyboard and mouse usage, network data (both downloads and uploads), and system uptime, enabling users to monitor their productivity on a granular level. By compiling these statistics, users can upload their data to the WhatPulse website, allowing for in-depth analysis of their computing habits, friendly competition with peers, and comparisons with a broader community.
The application captures various metrics, such as the total number of keystrokes and mouse clicks, as well as bandwidth consumption by different applications. One of the key features of WhatPulse is its ability to generate heat maps that visualize keyboard and mouse activity, providing further insights into usage patterns. The software also includes anti-cheat measures, limiting the maximum key presses to 50 per second to maintain the integrity of the data collected. Unlike keyloggers, WhatPulse focuses on counting key presses without recording the sequence, ensuring user privacy.
Key features of WhatPulse include:
- Count of keys and mouse clicks
- Daily history of keys and clicks
- Keyboard and mouse heat maps
- Application-specific usage metrics
- Network traffic monitoring with real-time charts
- Historical network traffic data
- System uptime tracking and application-specific uptime statistics
In addition to these functionalities, users can find resources related to system uptime checks in Windows and methods to display internet usage statistics on their taskbar. The introduction of version 6.1 further enhances the user experience, making it easier to understand and optimize computing habits.
As technology continues to evolve, WhatPulse stands as an essential tool for those looking to enhance their productivity by understanding their digital footprint better. Future updates may include more sophisticated analytics, integrations with productivity tools, and enhanced user interface features to further assist in optimizing work efficiency
WhatPulse 6.1 released
WhatPulse is designed for those curious about how much actual PC work is done by logging exactly what you are doing while working.