Sysinternals DebugView is a powerful tool designed to monitor debug data output on both local machines and across computers connected to a local area network. To enable remote monitoring, the application must be installed on the target machine and accessed via TCP/IP.
Key Features:
- Dual Display: DebugView can capture both kernel-mode and Win32 debug output, allowing users to bypass the need for conventional debuggers. It collects debug information without requiring changes to applications or drivers, accommodating non-standard debug output APIs.
- Portable Interface: The application is portable, eliminating the need for installation. Users can run it immediately after extraction from the downloaded archive. The user-friendly interface presents essential information upon launch, facilitating quick access to debug data.
- Filtering Options: DebugView includes a variety of filters that improve monitoring efficiency. Users can include or exclude specific data from the output and utilize a color palette to highlight important rows. The history depth setting allows users to control the number of entries displayed, tailoring views to their preferences.
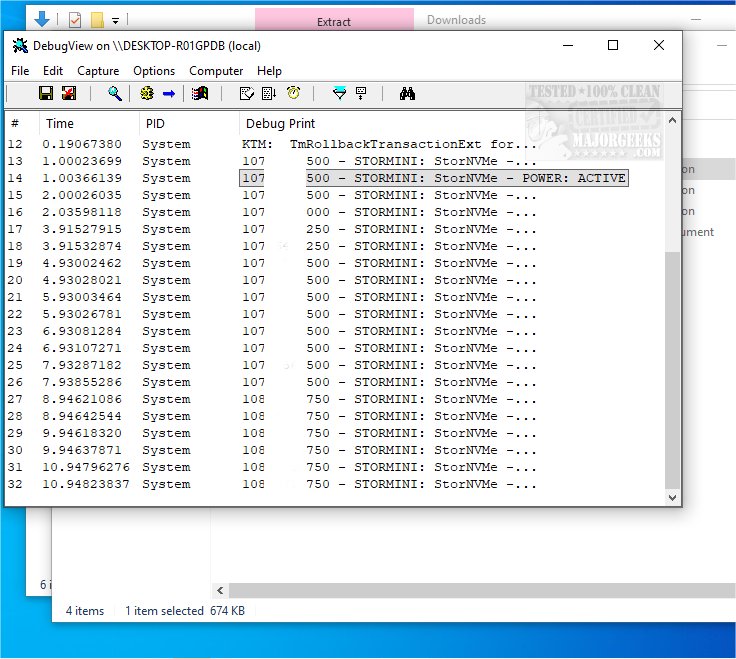
Functionality: Within the main application window, users have the ability to toggle kernel-mode debug output, clear outdated data, and apply filters for focused monitoring. DebugView captures:
- Win32 OutputDebugString
- Kernel-mode DbgPrint
- All kernel-mode variants of DbgPrint implemented in Windows and Windows Server
- Kernel-mode debug output from Windows crash dump files if the tool was active during the crash
Geek Verdict: DebugView is recognized as an intuitive and robust application that streamlines the process of monitoring debug output, whether on a local PC or across a network. Users can customize their experience to view either kernel-mode or Win32 output generated by the standard debug print API. Additionally, comprehensive documentation is provided, equipping users with the information needed to maximize their debugging experience.
Extension of Features: As technology evolves, future updates to DebugView could potentially include enhanced visualization tools, improved integration with modern development environments, and support for additional programming languages. The implementation of machine learning algorithms for smarter filtering and analysis of debug data could also be a valuable addition, making the debugging process even more efficient for developers. Users are encouraged to explore all available features and integrate this tool into their debugging workflows for improved productivity and better application performance
Key Features:
- Dual Display: DebugView can capture both kernel-mode and Win32 debug output, allowing users to bypass the need for conventional debuggers. It collects debug information without requiring changes to applications or drivers, accommodating non-standard debug output APIs.
- Portable Interface: The application is portable, eliminating the need for installation. Users can run it immediately after extraction from the downloaded archive. The user-friendly interface presents essential information upon launch, facilitating quick access to debug data.
- Filtering Options: DebugView includes a variety of filters that improve monitoring efficiency. Users can include or exclude specific data from the output and utilize a color palette to highlight important rows. The history depth setting allows users to control the number of entries displayed, tailoring views to their preferences.
Functionality: Within the main application window, users have the ability to toggle kernel-mode debug output, clear outdated data, and apply filters for focused monitoring. DebugView captures:
- Win32 OutputDebugString
- Kernel-mode DbgPrint
- All kernel-mode variants of DbgPrint implemented in Windows and Windows Server
- Kernel-mode debug output from Windows crash dump files if the tool was active during the crash
Geek Verdict: DebugView is recognized as an intuitive and robust application that streamlines the process of monitoring debug output, whether on a local PC or across a network. Users can customize their experience to view either kernel-mode or Win32 output generated by the standard debug print API. Additionally, comprehensive documentation is provided, equipping users with the information needed to maximize their debugging experience.
Extension of Features: As technology evolves, future updates to DebugView could potentially include enhanced visualization tools, improved integration with modern development environments, and support for additional programming languages. The implementation of machine learning algorithms for smarter filtering and analysis of debug data could also be a valuable addition, making the debugging process even more efficient for developers. Users are encouraged to explore all available features and integrate this tool into their debugging workflows for improved productivity and better application performance
Sysinternals DebugView 5.0 released
Sysinternals DebugView monitors debug data output on a local machine or across computers on a local area network. For remote monitoring, the application must be installed on the target machine and accessible via TCP/IP.