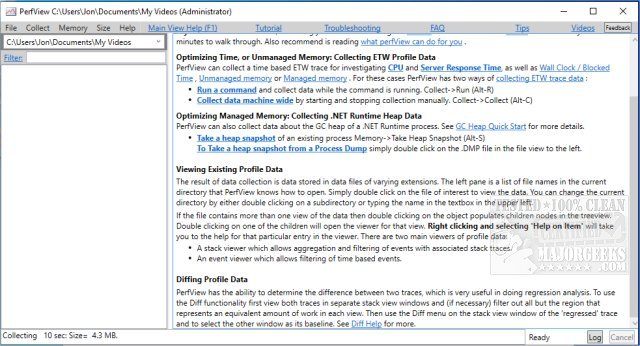
PerfView has recently released version 3.2.0, an enhanced portable application that streamlines the collection and analysis of CPU and memory performance data. This tool is particularly beneficial for application developers, offering essential capabilities for analyzing Event Tracing for Windows (ETW) information through ETL files and CLR memory data via heap dumps.
PerfView is specifically designed to assist developers in pinpointing the specific threads or functions responsible for performance issues, guiding them directly to the relevant source code for effective bug fixing or optimization. The application operates by capturing snapshots of the CPU stacks while temporarily interrupting CPU processes. Notably, it allows users to analyze the stack of all running processes or focus on a particular executable for troubleshooting.
In addition to its core functionalities, PerfView provides a detailed view of the stack collection, including metrics on the CPU's total cost and the overall performance impact. For users new to PerfView, there are comprehensive guides available that are highly recommended to ensure a smooth start.
As developers and system administrators increasingly rely on tools that enhance performance tuning and debugging, PerfView stands out by combining ease of use with powerful analytical capabilities. It is a crucial addition to any developer's toolkit, especially those working on performance-critical applications.
For further exploration of performance analysis tools, users might also consider related resources such as the Windows Memory Diagnostic Tool, methods for checking RAM speed and availability, adjusting Windows Defender CPU usage, and managing virtual memory settings in both Windows 10 and 11
PerfView 3.2.0 released
PerfView is a portable application designed to simplify the collection/analysis of CPU and memory-related performance data.