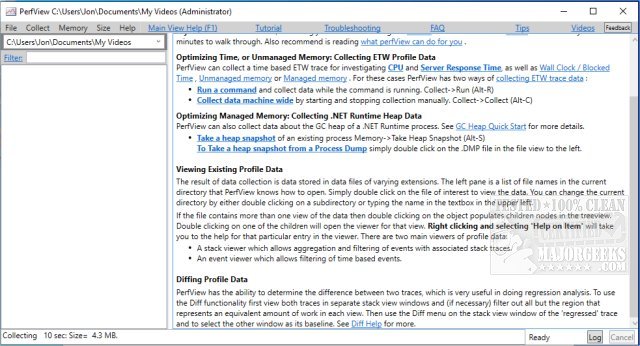
PerfView 3.1.30 has been released, enhancing its capabilities as a portable application aimed at simplifying the collection and analysis of CPU and memory performance data. Designed primarily for application developers, PerfView provides a comprehensive suite of tools for analyzing Event Tracing for Windows (ETW) information, specifically within ETL files, as well as CLR memory data through heap dumps.
The application is particularly useful for identifying performance bottlenecks by allowing users to focus on specific threads or functions that may be causing issues. This targeted analysis helps developers trace back to the corresponding source code, facilitating bug fixes and optimizations.
PerfView operates by capturing snapshots of process stacks while interrupting CPU activity, enabling an overview of all processes or a selected executable for detailed troubleshooting. It presents stack collection data, highlighting the total CPU cost associated with each function call, which is instrumental in pinpointing performance-draining components.
Users are encouraged to read the available guides to maximize their understanding and use of PerfView before diving into performance analysis. Additional resources are also suggested, including tutorials on using the Windows Memory Diagnostic Tool, checking RAM speed and available slots, adjusting Windows Defender's CPU usage, and managing virtual memory settings in Windows 10 and 11.
As PerfView continues to evolve, users can expect ongoing improvements and potentially new features that further streamline performance analysis and enhance developer productivity. The latest release not only addresses current needs but also sets the stage for future updates that may introduce advanced analytics capabilities or integrations with other development tools
PerfView 3.1.30 released
PerfView is a portable application designed to simplify the collection/analysis of CPU and memory-related performance data.


