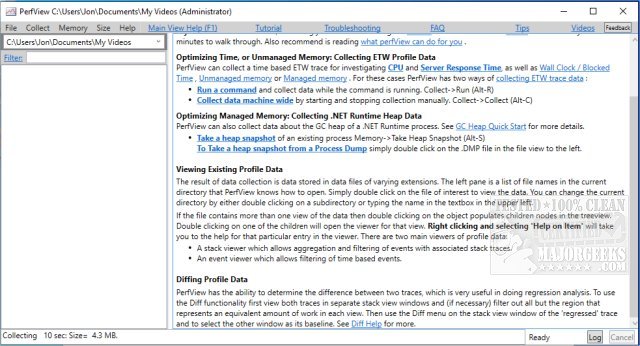
PerfView 3.1.29 has been released, enhancing its capabilities as a portable application that simplifies the collection and analysis of CPU and memory-related performance data. This tool is particularly beneficial for application developers, providing essential tools for analyzing Event Tracing for Windows (ETW) information through ETL files and CLR memory data via heap dumps. PerfView is designed to help users identify specific threads or functions causing performance issues, directing them to the relevant source code for bug fixes or optimizations.
The application operates by capturing snapshots of the call stacks while momentarily pausing the CPU's execution. It can gather stack data from all running processes or focus on a specific executable for targeted troubleshooting. Once the data is collected, PerfView presents an organized display of the stack collection, detailing the CPU's total cost and the overall performance impact.
Users are encouraged to consult the available guides to maximize the effectiveness of PerfView before diving into its features. These resources can provide crucial insights into various related topics, such as using the Windows Memory Diagnostic Tool, checking RAM speed and available slots, managing CPU usage with Windows Defender, and adjusting virtual memory settings in Windows 10 and 11.
In addition to these features, PerfView 3.1.29 could benefit from further enhancements, such as improved user interface navigation, additional performance metrics, and integration with more advanced debugging tools. Furthermore, ongoing updates could include community feedback mechanisms, allowing developers to suggest features or report issues directly within the application. This would help ensure that PerfView continues to meet the evolving needs of developers in a rapidly changing technological landscape
PerfView 3.1.29 released
PerfView is a portable application designed to simplify the collection/analysis of CPU and memory-related performance data.