PerfView 3.1.23 has been released, enhancing its capabilities as a portable application that streamlines the collection and analysis of CPU and memory performance data. This tool is particularly beneficial for application developers, providing them with essential functionalities to analyze Event Tracing for Windows (ETW) data (ETL files) and Common Language Runtime (CLR) memory data (heap dumps).
PerfView is designed to help developers pinpoint specific threads or functions that may be causing performance issues in their applications. By directing users to the relevant source code, it facilitates efficient bug fixing and optimization processes. The application operates by capturing snapshots of the CPU stacks, which can interrupt the CPU's normal operation. Users can gather stack data from all running processes or focus on a specific executable for targeted troubleshooting. PerfView presents the collected stack data, displaying the overall CPU cost associated with various processes, which aids in identifying performance bottlenecks.
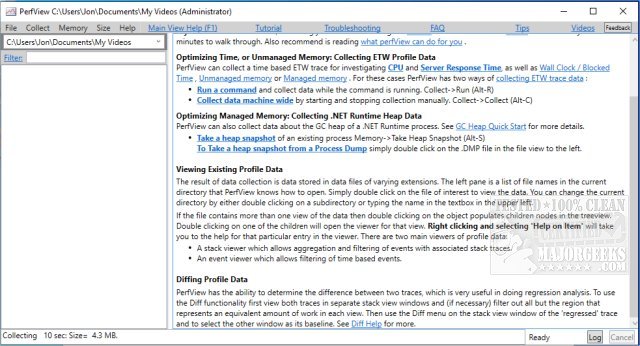
To maximize the effectiveness of PerfView, users are encouraged to consult the available guides before diving into the tool's features, as these resources provide valuable insights and best practices for usage.
In addition to the release of PerfView, it is important for developers to be aware of related tools and techniques for performance monitoring. This includes the Windows Memory Diagnostic Tool for checking RAM health, methods for assessing memory speed and available slots, adjustments to Windows Defender's CPU usage limits, and strategies for managing virtual memory (pagefile) settings in Windows 10 and 11. These complementary resources can help developers achieve a comprehensive understanding of system performance and enhance their troubleshooting capabilities
PerfView is designed to help developers pinpoint specific threads or functions that may be causing performance issues in their applications. By directing users to the relevant source code, it facilitates efficient bug fixing and optimization processes. The application operates by capturing snapshots of the CPU stacks, which can interrupt the CPU's normal operation. Users can gather stack data from all running processes or focus on a specific executable for targeted troubleshooting. PerfView presents the collected stack data, displaying the overall CPU cost associated with various processes, which aids in identifying performance bottlenecks.
To maximize the effectiveness of PerfView, users are encouraged to consult the available guides before diving into the tool's features, as these resources provide valuable insights and best practices for usage.
In addition to the release of PerfView, it is important for developers to be aware of related tools and techniques for performance monitoring. This includes the Windows Memory Diagnostic Tool for checking RAM health, methods for assessing memory speed and available slots, adjustments to Windows Defender's CPU usage limits, and strategies for managing virtual memory (pagefile) settings in Windows 10 and 11. These complementary resources can help developers achieve a comprehensive understanding of system performance and enhance their troubleshooting capabilities
PerfView 3.1.23 released
PerfView is a portable application designed to simplify the collection/analysis of CPU and memory-related performance data.