PerfView 3.1.22 has been released, enhancing its capabilities as a portable application aimed at simplifying the collection and analysis of CPU and memory performance data. This tool is particularly beneficial for app developers, providing essential utilities for analyzing ETW (Event Tracing for Windows) information through ETL (Event Trace Log) files, as well as CLR (Common Language Runtime) memory data via heap dumps.
The primary function of PerfView is to help developers identify specific threads or functions that may be causing performance issues, guiding them directly to the relevant source code for potential bug fixes or optimizations. The application operates by capturing snapshots of the CPU stacks, interrupting the CPU to gather data from all running processes, although users can opt to focus on troubleshooting a specific executable file.
PerfView not only displays the collected stack information but also presents critical metrics, such as the total CPU cost associated with each stack frame, which aids in efficient performance analysis. To support users in navigating the tool effectively, comprehensive guides are available and strongly recommended for users to review prior to usage.
In summary, PerfView 3.1.22 is a powerful resource for developers looking to enhance application performance through detailed analysis of CPU and memory usage. Its user-friendly interface and targeted functionality make it an invaluable part of the developer's toolkit.
For those interested in related topics, additional resources include guides on using the Windows Memory Diagnostic Tool, checking RAM speed, managing Windows Defender's CPU usage, and optimizing virtual memory settings in Windows 10 and 11. These complementary tools and techniques can further assist in ensuring optimal system performance
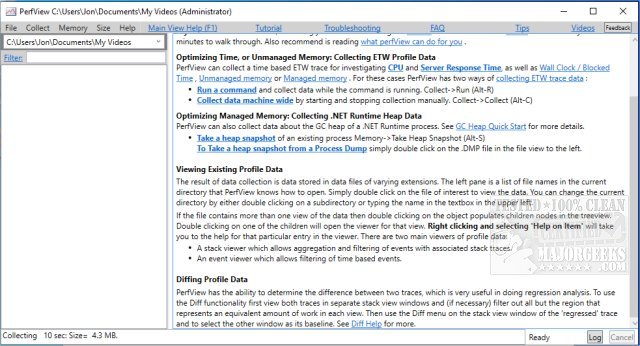
PerfView 3.1.22 released
PerfView is a portable application designed to simplify the collection/analysis of CPU and memory-related performance data.