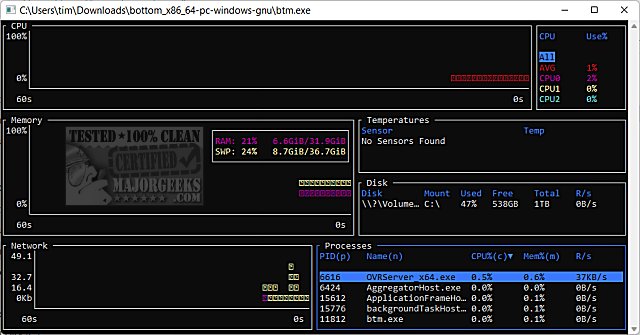
The latest version of the bottom (btm) monitoring app, version 0.11.0, has been released. This cross-platform application is designed to provide users with comprehensive graphical visualizations for various system metrics. Key features include real-time monitoring of CPU usage at both average and per-core levels, as well as RAM and swap memory utilization over time. Users can also track network input/output (I/O) over time, with the added functionality of zooming in and out to focus on specific time intervals.
In addition to these visualizations, bottom includes widgets that display critical information regarding disk capacity and usage, temperature sensor readings, and battery status. The app also features a process widget that allows users to view, sort, and search for processes, with capabilities to send kill signals and display processes in a tree structure for better organization.
To extend the functionality and usability of bottom, future updates could introduce additional monitoring options, such as GPU usage, storage read/write speeds, and customizable alerts for system performance thresholds. Integration with cloud-based monitoring tools could also enhance the app’s capabilities, allowing users to analyze their system performance remotely and gain insights into trends over time. Furthermore, a mobile version of the application could be developed, enabling users to monitor their systems on-the-go.
For users looking to optimize their system, bottom could provide educational resources or tutorials on related topics, such as checking memory (RAM) speed, identifying hard drive types (SSD or HDD), determining CPU core counts, and finding motherboard details on Windows 10 and 11. These resources would help users better understand their hardware, leading to more informed decisions regarding upgrades and system maintenance
bottom (btm) 0.11.0 released
bottom (btm) is a cross-platform monitoring app.